Product usage metrics reveal the relationship your customer has with your product—and provide context for the relationship you should be having with your customer. By capturing day-to-day information on how your customer uses your product, you can shape your actions to increase their overall experience and drive value.
In an economy where customers are loyal to personalized products and highly responsive service, visibility of customer behavior keeps you relevant. Product usage metrics tell you how your customer is currently using your service so you can tell them how to make even better use of it in the future.
5 Product Usage Metrics to Track
Metrics prove most useful when they not only track key performance indicators, but also lead to action. The metrics you use to track product engagement should relate to variables and outcomes you know affect your customer’s business goals. If these metrics are negative, you are alerted to potential churn—in time to do something about it.
Keep an eye on these product usage metrics to understand your customers as their needs and goals evolve:
- Usage frequency
- Average time in application
- Feature usage
- Active users
- License utilization
These metrics help you establish practical goals and KPIs you can implement at every stage of the customer journey, guiding your efforts to promote customer lifetime value.
1. Usage Frequency
Every time a customer uses your product, they increase their chances of achieving value. The onboarding phase is when a customer learns how to incorporate your product into their daily routine, so usage frequency metrics are best employed after a customer has cleared this initial stage.
This at-a-glance metric gives you an accurate indication of how often a customer logs-in to your product over any length of time. You can track an entire segment over a month, for example, and reveal the percentage of your customers that are daily, frequent, occasional, or inactive users. By measuring the results against benchmarked goals, you can identify accounts in need of support or those ready for expansion.
2. Average Time in Application
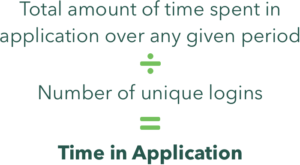
You can dive deeper into the customer experience by adding a duration variable to your usage frequency metrics. To find this number, use the following equation:

The results will let you know how long the average login lasts. These results have to be filtered through your own personalized KPIs and the customer’s history to generate relevant data. This information can provide valuable context for customer engagements. An escalation from a customer with a low average time in application may, for example, reveal a limited understanding of your product and the need for additional training.
3. Feature Usage
Gathering customer usage metrics is about making sure your customer is not only using your product but also accessing the appropriate features that drive them to reach maximum value. You can quantify this ambition by measuring how often they access product features you know are beneficial to their business goals.
Tracking user logins and feature usage can be an indicator of the customer’s understanding of your whole product and how it impacts their business goals. High marks indicate a healthy, well-informed customer experience. Low marks reveal the need for a campaign or engagement that educates the customer on the significance of the feature.
4. Active Users
Renewal and churn are not tied exclusively to anniversary dates. They are a direct result of the customer experience, and key decisions about either can happen at any time. A reliable indicator of a customer’s mood is their active usage metrics. This counts the number of active users within an account to establish a pattern. It can be filtered by active daily or active monthly users to provide proper context.
You can view results across customer segments in order to identify trends that may aid future campaigns. For example, your data may reveal a repeated lapse in use six months after onboarding that may indicate product fatigue and the need for a regular re-engagement campaign.
5. License Utilization
One sure-fire sign of a successful enterprise is an expanding headcount. This growth should be reflected in the number of active seats within a customer’s license agreement. By measuring the number of active accounts throughout the last year, you should develop a trend line that closely resembles a customer’s experience of value. A customer that is approaching their maximum license allocation is a prime target for expansion. Conversely, a stagnant growth rate could indicate the customer has maximized their potential and could benefit from a new, optimized agreement.
Each of these product usage metrics provide unique information about the customer experience. All of these, and more, can be combined to provide a complete picture of your customer’s journey.
The Benefits of a Customer Success Platform
The customer data that supplies these metrics should be captured, stored, analyzed, and shared within a single source. And the best way to do this is with a customer success platform that makes customer activity visible.
The information collected every time a customer accesses your product is gathered in the platform and can be sorted to generate meaningful insights. A complete customer history should be built up over every interaction, beginning with the information captured at the sales event and flowing through to the most recent activity. Having a system that tracks key metrics can draw a complete picture of your customer and inform you if the data indicates that a customer is struggling, allowing your team to take the appropriate action.
All the relevant information stored within your customer success platform can be distilled down to a single measurement of the customer experience. This customer health score is a color-coded, highly visual framework used to identify a customer’s status at any time. It allows you to prioritize high-value and at-risk customers.
By sharing access to this wealth of customer information across your enterprise, without artificial barriers or unique passwords, you give every team member a detailed context for every customer engagement. Your team will be able to have intelligent and meaningful engagements at any turn, and the opportunity to analyze customer data to identify ways to improve your product to deliver a valuable customer experience.
Product Usage Metrics Matter
Product usage metrics give you the power to improve the customer experience. They inform you of how your customer is currently using your product so you can introduce efficiencies, expand their product knowledge, and better link their workflows with business outcomes. You will also empower your enterprise by providing access to relevant data, which can bridge the gap between your product and customer success team members to help guide product and feature development.
From granular measurements to overall health assessments, product usage metrics are your guide to better understanding your customers and building a service that delivers.
Totango helps you optimize the customer experience. If you explore Spark, you’ll discover a goals-focused solution that breaks down the customer journey into easily manageable phases. Request a demo today to find out how you can better organize your customer success efforts.

